Momentum Shifts Across Competition Stages Shape Live Selection Strategies
Jakob Vogel · Aug 7, 2026
Momentum Shifts Across Competition Stages Shape Live Selection Strategies
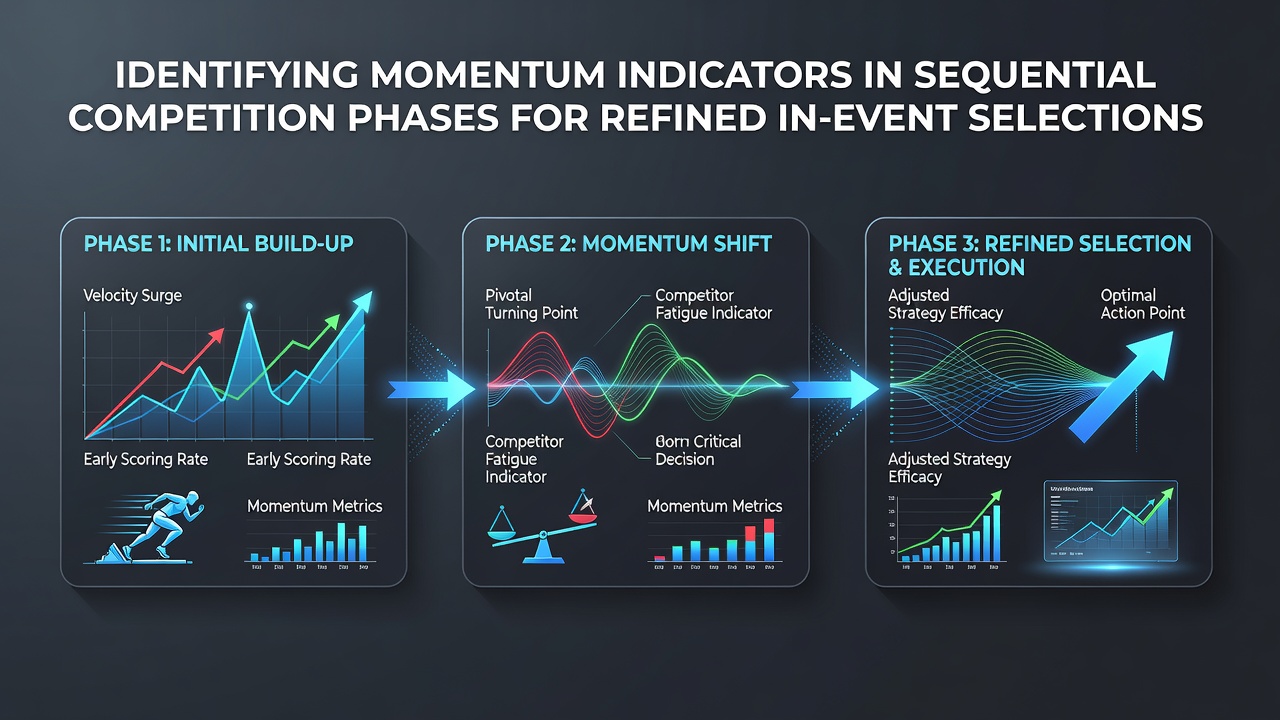
Sequential phases in competitive events create distinct windows where momentum indicators emerge, and data from multiple sports reveals patterns that inform in-event selections. Early stages often feature baseline performance metrics while mid-phases highlight acceleration or deceleration trends, and late phases expose fatigue or surge signals that alter outcomes. Observers note these transitions occur across soccer matches, tennis sets, and golf rounds, with statistics tracking possession streaks, point runs, and scoring sequences providing measurable signals.
Early Phase Baselines Establish Reference Points
Initial segments of events supply foundational data that later momentum shifts build upon or contradict, according to sports analytics reports from the NCAA. Teams or players establish average possession rates, shot accuracy, or serve percentages in the first quarter or set, and deviations from those baselines signal emerging momentum. Researchers have documented how a soccer side increasing pass completion from 78 percent to 87 percent within the opening 20 minutes correlates with sustained territorial gains, while tennis players converting 40 percent of break points early often maintain elevated rally win rates through subsequent games.
Mid-Phase Acceleration Patterns Reveal Turning Points
Transition periods between early and late stages concentrate the clearest momentum indicators, and studies from the Australian Institute of Sport track how consecutive positive outcomes cluster during these intervals. A run of three unanswered points in tennis or successive corners leading to shots on target in soccer frequently precedes scoreline changes, with timing data showing these clusters peak between minutes 35-55 in football fixtures and sets three through five in best-of-five matches. External factors such as weather adjustments in golf or substitution patterns in team sports further modulate these sequences, and analysts cross-reference them against historical event databases to refine live selections.
Late-Phase Fatigue and Surge Metrics Guide Final Adjustments
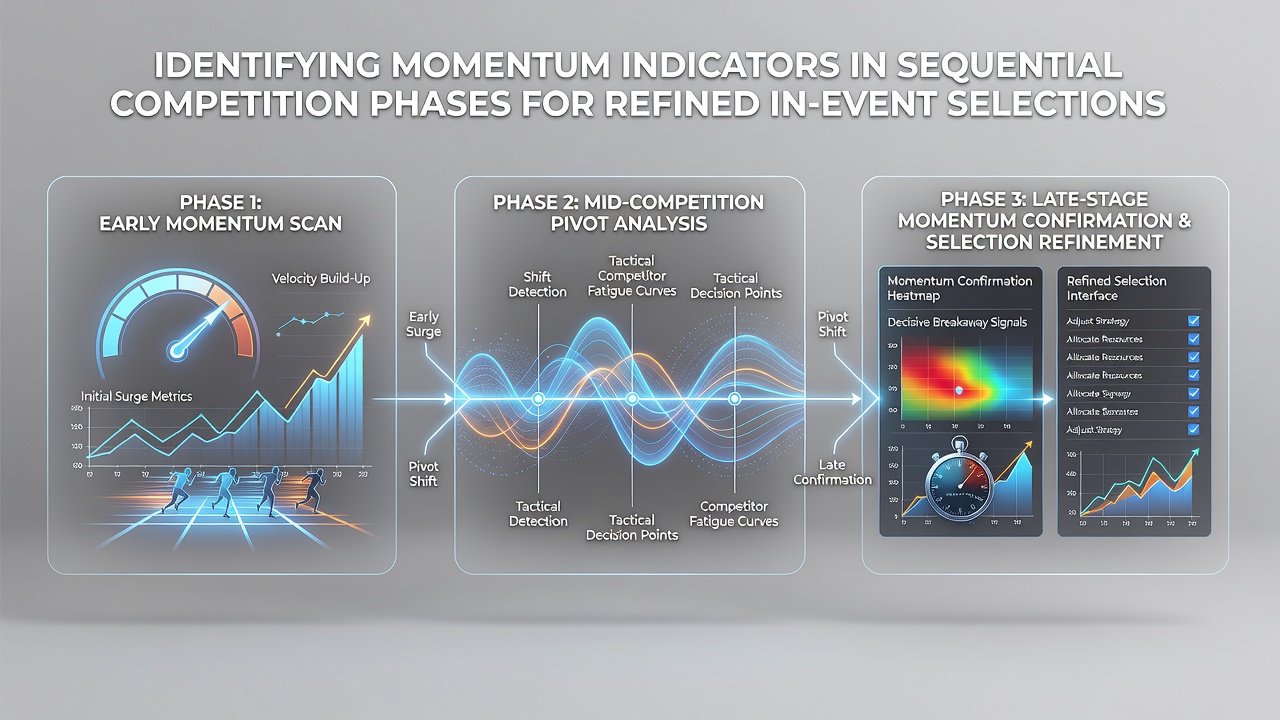
Final stages compress decision windows, and performance data indicates that indicators such as declining sprint distances or rising unforced error rates become pronounced after the 70-minute mark in soccer or during tiebreaks in tennis. Conversely, sustained high-intensity outputs in closing segments can mark decisive momentum surges, with figures from Canadian Sport Analytics showing athletes maintaining serve percentages above 65 percent in deciding sets outperforming season averages. These metrics integrate with cumulative phase data to adjust selections, particularly when events extend into extra time or additional sets where recovery capacity varies by competitor.
Cross-Sport Applications Highlight Common Indicators
Sequential phase analysis extends beyond single disciplines, and reports from the International Olympic Committee note parallels between momentum runs in team invasion sports and individual endurance events. A basketball squad achieving a 12-2 scoring run in the third quarter mirrors a golfer stringing together birdies on consecutive holes after the turn, with both sequences relying on measurable efficiency gains tracked through official statistics platforms. August 2026 schedules, including major international tournaments, will generate fresh datasets that test these phase-based models across varied climates and venues.
Integration With Live Data Platforms Supports Precision
Modern tracking systems deliver real-time feeds that align phase indicators with selection criteria, and industry analyses confirm operators now layer possession heat maps, rally length averages, and distance covered metrics into unified dashboards. Those monitoring events combine these streams with historical benchmarks to identify when early-phase stability breaks or mid-phase acceleration sustains, thereby narrowing option sets during active competition windows. Regulatory frameworks in multiple jurisdictions require transparent data sourcing for such tools, ensuring selections rest on verifiable performance sequences rather than isolated snapshots.
Conclusion
Sequential competition phases supply layered momentum indicators that refine in-event selections when tracked systematically across early, middle, and late segments. Data from established sports science bodies demonstrates consistent patterns in acceleration, fatigue, and surge metrics that appear across soccer, tennis, golf, and other disciplines. Observers applying these phase-specific signals to live environments draw on expanding datasets, including those anticipated from 2026 calendars, to maintain alignment between observed trends and selection adjustments.